
SME Customer Retention Strategy to Reduce Churn and Increase Lifetime Value
The Revenue Integrity Model: Designing Durable Growth After the Sale
Contents
1. The Structural Growth Error: How customer churn makes growth harder than it should be
2. Capital Allocation and Compounding: The true cost of customer churn
3. Revenue Durability: Net revenue retention and lifetime value
4. Profit Integrity: Acquisition dependency and cost-to-serve
5. Stability: Operational variance and cash flow
6. Expansion Architecture: Growing revenue from existing customers
7. The Post-Sale Maturity Model: From reactive delivery to engineered value
8. The Post-Sale Diagnostic: Assessing structural strength
9. Integration Across Revenue, Operations and Cost: Why post-sale cannot sit in one function
10. Strategic Close: Turning installed revenue into a strategic asset
Executive Summary
Many SMEs excel at winning customers but struggle to protect and grow the value of those relationships. The front end of the commercial engine gets all the attention, as acquisition pipelines are always tracked and sales targets are constantly managed. Yet post-sale ownership of the process fragments, incentives misalign, and as a consequence, capability gaps accumulate within the operating model, particularly in how organisations manage the after-sale customer relationship in practice.
The outcome is very familiar - delivering weak retention and uneven expansion. Margins are compressed and cash flow becomes volatile. Finally, growth just feels harder than it should.
The Revenue Integrity Model is a structured operating framework designed to protect and compound revenue after the initial sale. It integrates revenue, operations, and costs into a coherent operating system. The result is stronger margin per account, improved capital efficiency, and reduced acquisition dependency.
Small structural shifts in retention, expansion, and cost-to-serve compound over time. Installed revenue is the revenue already captured from existing customers. It is where most long-term profitability actually sits, but without alignment after the sale, any growth amplifies weakness. While with a truly aligned operation, it strengthens value.
This article explains the economic rationale for the model, details the business repercussions of ignoring it, and offers a workable structure for executives aiming for more resilient and profitable growth, with less reliance on acquiring new customers to maintain progress.
If growth feels harder than it should, look at the organisation’s architecture, not the market.
Who is This For?
A note on language before we begin. “After-sales” and “aftermarket” are established terms in sectors such as manufacturing, capital equipment, and technology. But every business has an “after the sale” moment - the point at which a promise made during the sales process becomes the customer’s lived experience. These dynamics show up everywhere, no matter the industry. Customers are retained, expanded, or lost based on what happens after the sale.
Throughout this paper the terms ‘after the sale’ and ‘post-sale’ are used deliberately. ‘After the sale’ refers to the commercial reality of the customer relationship once a deal is won. ‘Post-sale’ refers to the internal systems, processes, and operating structures that support it. In practice, the two are inseparable.
The Revenue Integrity Model is the structured discipline of protecting and compounding revenue across existing customer relationships. It integrates revenue durability, operational stability, and cost integrity into a coherent operating model rather than managing each in isolation. The result is a business that can systematically reduce customer churn, expand existing relationships, and improve margin without relying on new acquisition to compensate for structural leakage.
The language throughout this piece deliberately avoids 'after-sales' and 'aftermarket' in favour of 'after the sale' and 'post-sale' - because these dynamics are not sector-specific. The structural blind spots described here appear consistently across industries, business models, and markets.
Organisations are built to win, but sustaining what they win requires deliberate design.
The Structural Growth Error: How customer churn makes growth harder than it should be
Picture an SME with an active pipeline, and new customers being ‘captured’ consistently. Their revenue has grown from £9m to £12m over three years, and from the outside, it appears to be a success story.
Yet margin has tightened from 22 percent to 16 percent. Operational pressure is constant, and customer complaints are rising. Cash flow is fluctuating, and each year feels like a complete restart rather than a natural progression.
The instinctive response is predictable: increase sales intensity, drive productivity harder, and tighten cost control, often without recognising where cost reduction removes capability rather than improving performance. But none of these interventions address the underlying issue.
The business has been designed to acquire revenue, not to systematically protect and expand it.
At the point of sale, expectations are negotiated, and commitments formalised. Post-sale, ownership diffuses, and accountability fragments. The boundaries around pricing soften, and exceptions accumulate. But leadership attention has moved on to the next opportunity. Nothing appears visibly broken, but value has already begun to erode.
The reality is that most SMEs treat revenue as an event rather than an asset. An event must be replaced, whereas an asset must be protected and compounded.


Fig 1. Leaky Bucket Syndrome
This is the leaky bucket problem - new revenue pours in at the top through sales effort, marketing investment, and pipeline activity. Meanwhile, value leaks quietly from the bottom - through churn that goes unaddressed, cost-to-serve that goes unmanaged, and expansion opportunities that are missed. The bucket never fills because nobody is watching the holes.
The instinctive response is to accelerate the front end rather than fix the leaks. That may deliver growth, but the leakage continues.
The failure is not in the people, it is in the design of the system.
The economics behind this situation are well established. Harvard Business Review has consistently reported that the cost of acquiring a new customer significantly exceeds the cost of retaining an existing one - and that even modest improvements in retention produce outsized gains in profitability.
Businesses that systematically improve customer lifetime value through retention, structured expansion, and cost-to-serve discipline consistently outperform those that rely on new acquisition volume alone.
Yet most SMEs allocate their heaviest investment (sales resources, marketing spend, leadership attention) to the very front end of the customer relationship, and comparatively little to the support services that determine whether that investment is ever fully recovered and optimised. However, when a business loses a significant portion of its revenue each year, the sales team spends its time running on the spot.
When revenue is treated as a transaction, acquisition dominates performance management. When it is treated as an asset, attention shifts to retention, expansion, and cost discipline. The distinction is economic, not philosophical.
Over time, the consequences compound. Revenue may continue to rise, but margin thins, operational strain increases, and cash flow becomes less predictable. Leadership responds with more effort instead of redesigning the system.
Many SMEs are not constrained by demand, capability or ambition. They are constrained by an operating model built for an earlier stage of growth, one that prioritised winning work, but did not evolve to optimise value after it was secured.
The Revenue Integrity Model corrects this structural bias.
Capital Allocation and Compounding: The true cost of customer churn
At its core, growth is about capital allocation, not sales volume. Every pound invested in acquisition, retention, service capability, or operational efficiency represents a choice about return.
Take a £10m B2B SME operating at 90 percent annual retention. Each year, £1m of revenue must be replaced before the business grows at all. If the average cost of acquisition is 20 percent of first-year revenue, approximately £200,000 must be invested simply to stand still.
Now assume retention improves from 90 percent to 95 percent. Churn falls from £1m to £500k. Immediately, £500,000 less revenue must be replaced. The acquisition burden reduces, and sales capacity that was previously defensive becomes available for genuine growth. Five points looks small on a spreadsheet, but the economic impact is anything but.
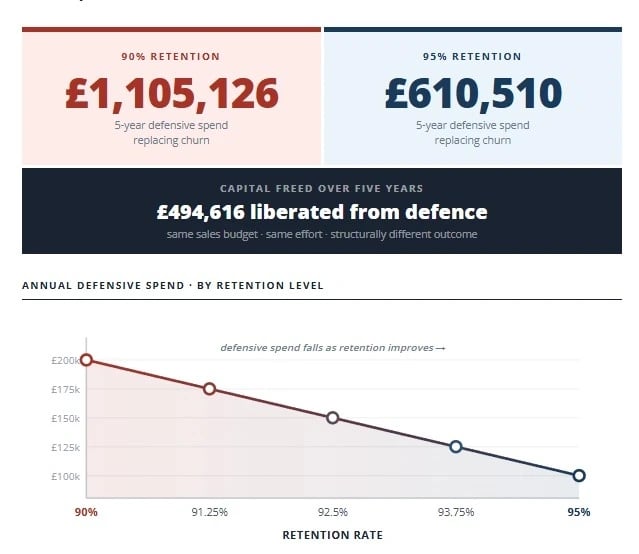
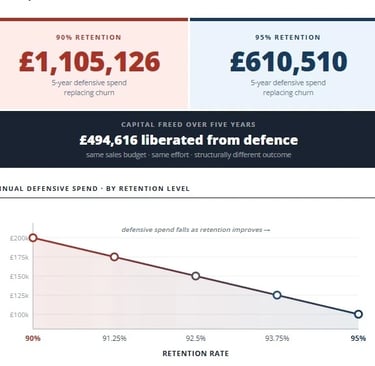
Figure 2: The capital liberation effect
A business operating at 95 percent retention carries forward a larger installed revenue base each year than one operating at 90 percent. Expansion, pricing improvements, and cross-selling apply to a broader foundation. Over time, the gap between the two models widens significantly.
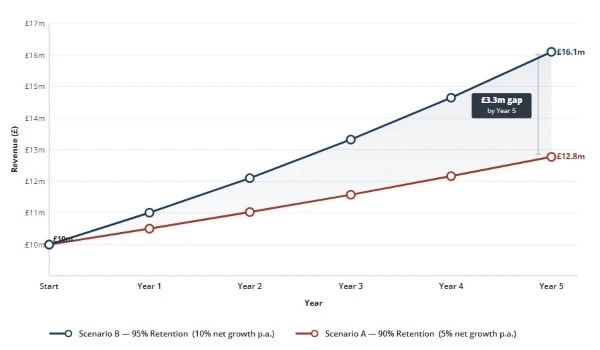
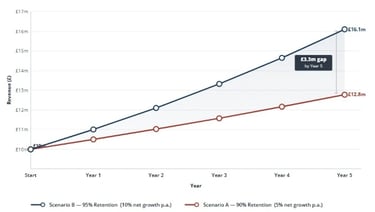
Figure 3: The compounding gap
The compounding effect becomes clear when two identical businesses are compared over time. One retains 90 percent of its revenue each year, the other 95 percent. Sales effort remains identical, but the retained base grows at very different speeds.
By Year 5, Scenario B exceeds £16m, while Scenario A reaches just £12.8m. That £3.3m gap is not the result of market conditions, or effort. It is an outcome driven by the structure. Under weaker retention, sales investment replaces churn, while under stronger retention, it compounds. Fundamentally, strong retention changes the economics by lowering the cost of growth.
If retention falters, the organisation inevitably leans harder on acquisition. Targets rise, discounting increases, and operational strain intensifies. Revenue grows, but margin tightens, and cash flow becomes more sensitive to timing. The result is that revenue rises, but the business becomes more fragile.
Capital allocation discipline reframes the leadership question. Instead of asking, “How do we increase sales?”, the more precise question becomes, “How do we increase the return on installed revenue?”
That shift redirects attention toward retention quality, expansion architecture, cost-to-serve consistency, and margin density. Small structural improvements in these areas produce compounding effects that exceed equivalent increases in acquisition effort.
If improved post-sale design lifts effective customer lifetime value by even 15 percent, acquisition cost as a proportion of lifetime margin falls automatically. The same customer becomes economically more attractive. Growth requires less incremental capital per unit of revenue added.
Over a five-year horizon, the difference between acquisition-led growth and structurally compounded growth becomes pronounced. One model relies on volume and suffers margin pressure; the other builds efficiently and strengthens over time.
That reallocation is the foundation of what the Revenue Integrity Model is designed to achieve.
Revenue Durability: Net revenue retention and lifetime value
If capital allocation defines the discipline of growth, revenue durability determines whether that discipline strengthens or erodes over time.
Three metrics define durability: retention, Net Revenue Retention (NRR) and lifetime value (LTV). Viewed together, they describe the economic integrity of the installed base.
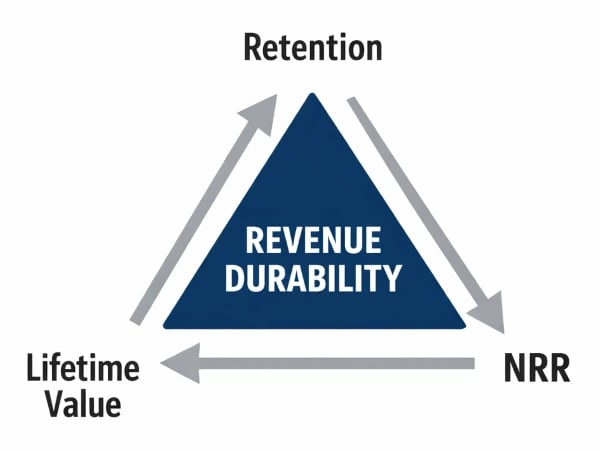
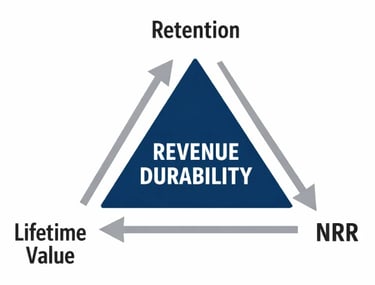
Figure 4: Revenue durability
Retention is the starting point. In a £10m business, 90 percent retention requires £1m of revenue to be replaced annually before growth begins. At 80 percent, that figure doubles to £2m - and the consequences reach beyond the balance sheet. Sales teams repeatedly replacing churn are not expanding the business, they are rebuilding it. Operational teams are onboarding new accounts while managing the ‘departures’. Leadership attention is drawn toward short-term recovery rather than long-term strengthening. The lower-retention model demands significantly more effort simply to maintain parity.
Retention reveals whether the operating model is working. But in many organisations, this is constrained by how performance is measured and managed across the business, shaping behaviours that don’t always align with the intended outcome. Persistent churn almost always reflects structural misalignment between expectation, ownership, and delivery. Addressing this fundamental issue requires design, not good intentions.
NRR depends entirely on the quality of relationships the business has already built. Without retention, there is nothing to expand. Retention is the foundation, whereas expansion is what builds on it.
This is where NRR becomes critical, as it measures the revenue retained from existing customers. This includes upgrades, cross-selling, up-selling, and price adjustments, net of contraction and churn. An NRR of 100 percent means the installed base holds steady without new acquisition. Above 100 percent, the base grows organically.
For example, an NRR of 105 percent converts a £10m installed base into £10.5m before a single new customer is added. At 110 percent, it becomes £11m. The additional revenue typically carries stronger margins because acquisition costs are minimal and delivery systems already exist.
Over time, even modest improvements in NRR compound materially. A structurally managed expansion pathway turns the installed base into an internal growth engine rather than a static revenue pool.
In many SMEs, expansion remains opportunistic. Cross-selling depends on individual initiative, pricing uplifts are inconsistent, and reviews are reactive. Without structure, NRR drifts, but with it, it accumulates.
LTV translates retention and expansion into economic terms. It asks a simple but powerful question: how much margin will this customer generate over its economic life? If an account produces £50,000 in annual margin and remains for five years, lifetime margin reaches £250,000 before acquisition cost. Improve average lifespan to seven years, and lifetime margin increases significantly. Introduce structured expansion that raises annual margin to £60,000, and the cumulative effect becomes more pronounced.
Small structural improvements in retention and expansion materially increase LTV.
This has direct implications for acquisition economics. If acquisition cost is £40,000 and lifetime account margin is £250,000, the return profile is attractive. If that figure increases to £350,000 through improved durability and expansion, acquisition becomes even more efficient. The same sales investment produces greater long-term return.
Conversely, if churn shortens lifespan or cost-to-serve erodes margin, LTV compresses. Acquisition costs absorb a larger share of value created. Growth becomes more capital intensive and less resilient.
Together they describe the economic strength of the installed base -retention reducing replacement burden, NRR increasing internal growth velocity, and expanding LTV improving capital efficiency.
When these elements are engineered deliberately, growth deepens. When they are left to drift, growth becomes fragile, even if top-line revenue appears healthy.
The Revenue Integrity Model exists to ensure that revenue durability is designed rather than assumed.
Profit Integrity: Acquisition dependency and cost-to-serve
Durable revenue makes the entire growth model more capital-efficient. But if acquisition and delivery economics are unstable, that advantage erodes. Profit integrity is dependent on both how growth is funded and delivered.
Two forces damage margin in many SMEs: acquisition dependency and uncontrolled cost-to-serve. Individually, each creates distortion. But combined, they make growth far more expensive than headline revenue suggests.
Acquisition dependency emerges when churn is high or expansion is weak. In these conditions, new sales must compensate for structural leakage. In response, a business typically increases both its sales targets and the focus on the pipeline. As the pressure increases, discounting becomes more common as momentum is protected.
If winning a £100,000 account requires £20,000-£30,000 in combined sales and marketing investment, that capital must be recovered through margin over time. If customer lifespan is shorter than expected, or cost-to-serve is inconsistent, the payback period extends. Essentially, cash is consumed upfront, while revenue and margin materialise incrementally.
In highly acquisition-dependent models, even minor sales underperformance exposes fragility. Working capital becomes sensitive to timing, and leadership efforts concentrate on feeding the pipeline rather than strengthening the base. The role of acquisition should be to accelerate growth, not to compensate for uncontrolled leakage.
Cost-to-serve introduces a second layer of distortion. In most SMEs, delivery economics vary significantly across customers, yet pricing rarely reflects it. Some accounts operate within a clearly defined scope, generate predictable workload, and deliver consistent margins. Others create frequent exceptions, generate complaints, create friction, and thereby consume disproportionate operational bandwidth. However, pricing may not reflect this variation.
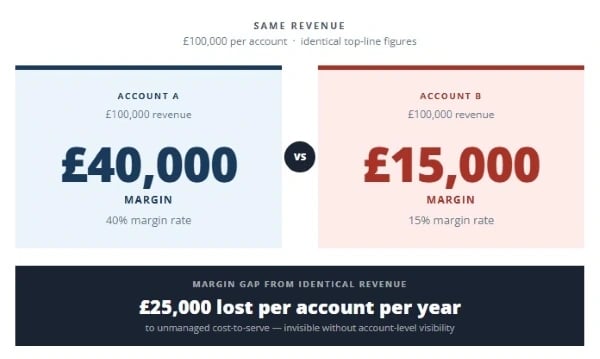
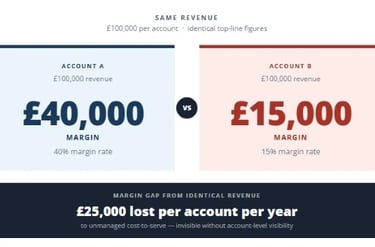
Consider two £100,000 customer accounts. Identical revenue, but wildly different economics.
Without clarity, sales may pursue lower-margin profile customers, reinforcing dilution. As volume increases, complexity accumulates and operational variance rises. Consequently, growth magnifies inefficiency rather than profitability.
In one engagement, a mid-sized B2B services business conducted a structured review of its installed customer base and discovered a familiar imbalance. A small proportion of customers generated the majority of revenue and margin, while a long tail of lower-value accounts consumed disproportionate operational capacity and leadership attention.
Their review revealed that it was not a sales performance issue. The problem was simply that they were treating all revenue as equal.
In the resulting project, customers were scored across strategic importance, revenue contribution, margin profile, and growth potential - producing a ranked league table that made relative value visible for the first time. A second framework assessed resource intensity: complaint levels, service exceptions, and payment behaviour. Together they revealed a clear picture of where effort was being deployed relative to where value was actually being created.
Customers were segmented into three tiers. High-contribution accounts received structured key account management. Mid-tier accounts were given defined expansion pathways. Low-contribution, high-variance accounts were migrated to clearer service boundaries or allowed to exit.
Total customer count fell - yet net revenue increased, operational strain reduced, and the business became simpler and faster for its remaining customers to deal with.
Ultimately, making the portfolio economically coherent was not a customer service initiative. It was the business ensuring capital allocation was applied effectively.
Risk intensifies when acquisition dependency and cost distortion intersect. Heavy investment wins new work, flexible delivery preserves goodwill, and exceptions accumulate. Cost-to-serve rises, margins weaken, and the deterioration compounds over time. So, while growth may look strong on the surface, the economics are deteriorating underneath.
Aligning commercial ambition with delivery reality is central to how the Revenue Integrity Model works. The model ensures that operational capacity is protected for accounts that reinforce long-term value rather than those that merely maintain volume.
The objective is not to reduce service quality, it is to ensure that effort and economics remain aligned.
Figure 5: The cost-to-serve distortion
Stability: Operational Variance and Cash Flow
Profit integrity protects margin, while stability protects resilience. A business can report acceptable margins and still feel fragile if operational variance is high and cash flow unpredictable.
In many SMEs, instability is not caused by external volatility, but by the operational consequences of structural misalignment. Small cracks appear - slower responses, more noise from customers, creeping scope. Senior leaders then get drawn into issue resolution more often than they should be. None of these incidents are catastrophic in isolation, but collectively they erode predictability.

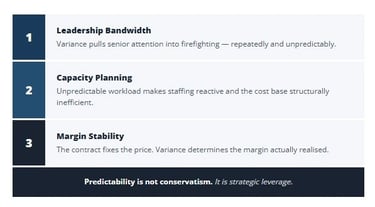
Figure 6: The hidden costs of operational variance.
The trouble with variance is that it accumulates out of sight, and the cost only becomes obvious later.
That instability is increasingly formalised on the customer side. Today's buyers are more commercially sophisticated and better informed than at any previous point. Contracts now include delivery penalties, performance deductions, and service level failures as standard clauses, not exceptional ones. When operational variance triggers those penalties, the impact lands directly on margin - on revenue that was already contracted and considered secure.
The price is fixed in the contract, but the margin is determined in delivery. This distinction becomes especially important when considering cash flow.
Revenue does not automatically translate into cash stability. In acquisition-heavy models, commissions are paid early, marketing spend is incurred upfront, and onboarding effort is intensive. If retention underperforms or cost-to-serve exceeds expectations, the payback period extends. Liquidity tightens even while reported revenue grows.
High churn combined with high acquisition intensity creates structural pressure on working capital. By contrast, in a well‑designed system, retention and cost discipline create margin stability rather than volatility. Acquisition efforts are incremental rather than defensive. Cash conversion improves because revenue streams are more stable and less capital is required to replace lost accounts.
Stable margins allow leadership to invest deliberately rather than reactively. Confidence in the organisation’s pricing increases and reliance on financing reduces.
Operational stability delivers far more than efficiency alone; it becomes a financial and strategic asset. It also determines whether automation can be deployed effectively without amplifying underlying weaknesses.
The Revenue Integrity Model reduces variance by clarifying ownership post-sale, defining service tiers explicitly, and aligning commercial commitments with delivery capacity. When revenue durability, profit integrity, and operational stability reinforce one another, growth becomes more predictable and requires less effort.
At that point, expansion builds on stable foundations rather than wavering under operational strain.
Expansion Architecture: Growing revenue from existing customers
If retention stabilises the revenue base and cost discipline protects margins, expansion determines how efficiently value accumulates.
Many SMEs rely on opportunistic expansion. Cross-selling depends on individual initiative rather than structural expectation, and pricing reviews are reactive instead of scheduled. Some accounts might expand significantly, while others remain static for years, but even though growth occurs, without design the result is inconsistent.
Expansion architecture corrects this. It treats the installed base as a structured portfolio rather than a collection of relationships.
Segmentation comes first
Not segmentation by industry alone, but by account-level margin profile, strategic fit, and growth potential. High-contribution, strategically aligned accounts warrant structured expansion pathways. Low-margin, high-variance accounts require boundary discipline before any growth is pursued.
Tier clarity follows
Service tiers must be defined in commercial terms, not just operational ones. What does each level include, and what is excluded? What triggers movement between tiers? Without tier clarity, expansion blurs into informal scope creep and margins weaken.
The third element is cadence
Expansion cannot rely solely on goodwill or end-of-contract negotiations. Structured value reviews, scheduled performance discussions, and predefined commercial checkpoints create rhythm. This rhythm transforms expansion from reactive upselling into managed customer portfolio growth.
Consider a £10m business with 100 core accounts averaging £100,000 each. If structured expansion increases average account value by 3 percent annually through disciplined cross-selling and pricing governance, the installed base grows by £300,000 per year without incremental acquisition cost.
Over five years, that incremental growth compounds on itself - and because the relationship, the systems and the delivery infrastructure are already in place, it does so at structurally higher margin than equivalent revenue won through acquisition.
Now compare that to pursuing £300,000 of new revenue through new acquisition. Sales effort, marketing cost, onboarding risk, and delivery ramp-up all increase capital intensity.
Expansion architecture boosts capital efficiency by building on relationships you already have.
However, expansion without cost discipline can create distortion. If higher tiers are not priced correctly, or if delivery capability is stretched, revenue increases while margins decline. This is exactly why expansion must sit within the Revenue Integrity Model rather than as an isolated commercial initiative.
Get the foundations right, and expansion can compound without restriction. When they are not in place, expansion accelerates instability.
Architected expansion therefore rests on three principles:
• Defined service boundaries.
• Structured commercial cadence.
• Margin visibility at account level.
Without these, growth remains opportunistic, but with them, it becomes planned portfolio management.
The Post-Sale Maturity Model: From reactive delivery to engineered value
Not all SMEs sit at the same stage of post-sale development. The interventions required at each stage are different, and what appears to be a performance issue is often a maturity issue in the operating model.
Broadly, four stages tend to emerge.
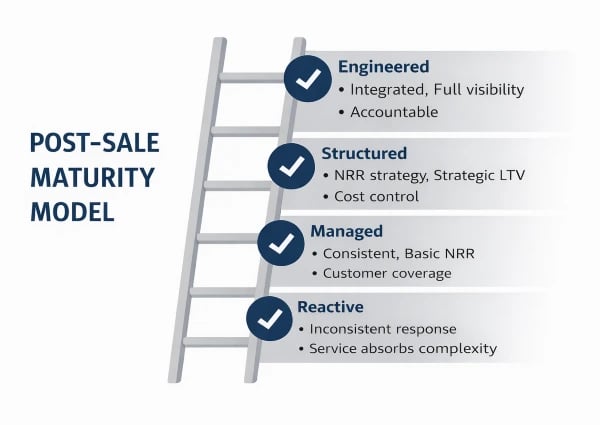
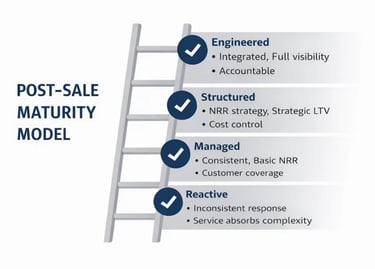
Figure 7: The post-sale maturity model
Stage 1: Reactive
Revenue is won successfully, but ownership post-sale is unclear. Service delivery is responsive but inconsistent. Customer complaints are common. Expansion is opportunistic. Cost-to-serve is largely invisible.
Growth is effort-driven. Performance depends heavily on individual capability.
Stage 2: Managed
Basic account ownership is defined, and service processes exist. Some segmentation is in place, retention is monitored, and expansion occurs through periodic review rather than accident.
However, integration across revenue, operations, and costs remains limited. Account-level margin visibility is partial. The risk at Stage 2 is that acceptable performance removes the urgency to redesign.
Stage 3: Structured
Service tiers are clearly defined and commercially aligned. Cost-to-serve is understood at segment level, and expansion follows a planned cadence. Retention and NRR are actively managed, and variance is both tracked and addressed systematically.
Growth steadies, margins firm up, and leadership finally gets to focus on optimisation.
Stage 4: Engineered
Post-sale is treated as a capital system. Retention targets inform acquisition strategy, and account-level margin data shapes segmentation. Expansion pathways are embedded, and operational variance is minimised through structural design. Cash flow becomes significantly more stable relative to revenue.
At this stage, installed revenue strengthens with less incremental effort. Acquisition is now accelerating growth rather than sustaining it.
Many SMEs that appear commercially successful still operate structurally between Stage 1 and Stage 2.
The transition to Stage 3 and beyond requires deliberate redesign, not incremental improvement.
The Revenue Integrity Model provides the architecture for that progression.
The Post-Sale Diagnostic: Assessing structural strength
Most leadership teams believe they understand their post-sale performance, but few have examined it structurally.
For SME leaders looking to build durable revenue after the sale, the diagnostic begins with five structural domains.
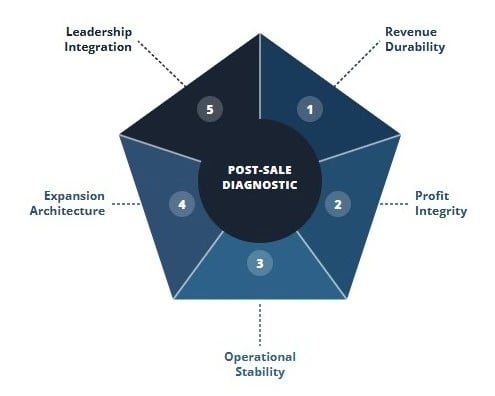
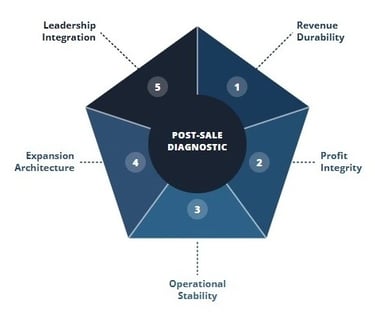
Figure 8: The post-sale diagnostic
The purpose of the Post-Sale Diagnostic is not to score operational competence. It is to assess whether the operating model is designed to protect and compound value after acquisition.
1. Revenue Durability
Do you know your true retention rate by segment?
Is NRR tracked and actively managed?
Is expansion structured or incidental?
2. Profit Integrity
Can you identify margin by account or segment?
Do you understand cost-to-serve variation?
Are pricing decisions informed by delivery reality?
3. Operational Stability
Is post-sale ownership clearly defined?
Are service tiers explicit and commercially aligned?
Is variance measured and addressed systematically?
4. Growth Economics
What proportion of sales capacity is consumed replacing churn?
Is LTV improving or compressing?
Is sales capacity building momentum or defending baseline revenue?
5. Leadership Integration
Are revenue, operations and cost decisions aligned?
Is post-sale performance discussed at board level?
Are incentives reinforcing durable growth or short-term volume?
Individually the questions may appear straightforward, but together they reveal whether growth is structurally resilient.
Many businesses discover that performance issues attributed to market pressure or competitive intensity are rooted in internal design. Others find that strong sales results are masking fragile margin.
The real objective for all organisations is clarity, as once structural weaknesses are visible, they can be redesigned. The Revenue Integrity Model begins with diagnosis.
Integration Across Revenue, Operations and Cost: Why post-sale cannot sit in one function
What the diagnostic consistently reveals is that the most damaging blind spots sit at the boundaries between functions - where revenue decisions, operational design, and cost management are made independently of one another. Unfortunately, revenue, operations, and cost are typically treated as separate conversations.
Sales focuses on volume and pipeline.
Operations focuses on service delivery.
Finance focuses on margins and control.
Following the sale, these domains continue largely in parallel, but the economics of post-sale performance do not.
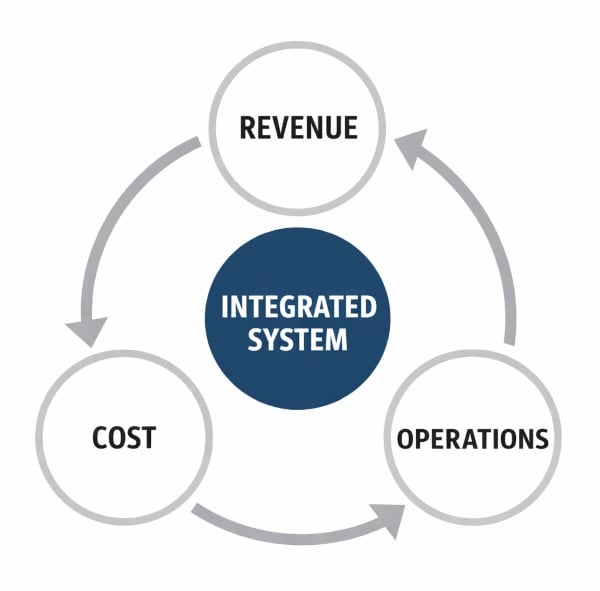

Figure 9: The integrated system
In one organisation, customer service, field service, technical support, and sales operated as separate functions with different reporting lines and no structural mechanism for sharing intelligence or workload. Single point failures were routine. Customer experience varied depending on which function an account happened to be in contact with, and no one had a coherent view of any relationship across all its touchpoints.
The intervention was structural rather than procedural - addressing reporting lines, role design, and decision authority rather than adding process layers on top of an already fragmented model. The changes required deliberate architectural thinking and careful change management, but they did not require additional headcount.
The outcomes compounded. Single point failures disappeared, and customer experience became consistent. Intelligence gathered across service, technical, and commercial conversations began flowing into a single account view. In turn this created the conditions for structured expansion that fragmented functions had never been positioned to identify.
What had been a fragmented cost centre became a commercially aware, customer-intelligent operation. Service levels improved, and that improvement reflected directly in sales performance.
This is integration in practice - not tighter reporting, but structural redesign of how the organisation faces its customers.
The structural conditions that created that fragmentation are not unique to one organisation.
When sales incentives reward volume without regard to lifetime margin, acquisition dependency grows, and similarly, when operations absorb complexity without commercial boundaries, cost distortion accelerates. The same logic applies to finance - cost reduction without segment visibility risks undermining the very accounts that generate the highest long-term value.
Independent optimisation weakens the system as a whole, often driven by assumptions and practices that have never been re-examined, and the impact ultimately lands on both the customer relationship and the numbers.
Therefore, integration of these domains is intentional within the Revenue Integrity Model.
· Revenue decisions are evaluated for durability.
· Operational design reflects commercial reality.
· Cost visibility informs pricing and segmentation.
This integration is not about tighter reporting, it is about structural alignment. The system only performs when its parts are designed to work together. Post-sale performance cannot sit in customer service alone. It cannot sit only in account management. Nor can it be reduced to simple financial review.
It is a leadership-level system. Without integration, effort increases. With integration, architecture does the work.
Strategic Close: Turning installed revenue into a strategic asset
Sustainable growth rarely comes from working harder or winning faster. Instead, it comes from redesigning the structure that sits behind revenue.
Installed revenue is where the majority of long-term profitability actually resides.
When retention, expansion, and cost discipline are designed rather than assumed, installed revenue compounds, and growth stops feeling like a permanent emergency.
These are not tactical adjustments, they are architectural decisions.
Most SMEs have invested heavily in winning work, but far fewer have invested deliberately in designing what happens after the sale. The consequence is effort-dependent growth, recurring operational pressure, and margin sensitivity that feels disproportionate to revenue scale.
The Revenue Integrity Model reframes that dynamic.
It treats installed revenue as a capital asset. It integrates revenue, operations, and cost into a coherent system, and it replaces reactive intervention with planned, engineered progression.
For leadership teams prepared to examine structure rather than symptoms, the upside is material.
It is not incremental improvement, it is strategic advantage.
What Happens Next
If this analysis resonates, the next step is clarity.
Complete the Revenue Integrity Diagnostic (link below) to identify structural strengths and weaknesses in your customer retention strategy across revenue durability, cost integrity, and operational stability.
→ Revenue Integrity Diagnostic
From there, it becomes possible to determine whether incremental adjustment is sufficient or whether deeper redesign is required - and whether that is a conversation worth having.
For those wanting to explore specific themes in depth, a growing series of articles and diagnostic tools is available via the Insights page.
The evidence base behind this framework is set out in After-sales Excellence: Driving Improvement, Customer Satisfaction and Growth by Nigel Woodall - a practitioner's examination of the structural errors organisations repeatedly make after the sale, and why they persist.
Durable growth is never accidental. It is always designed.
Copyright © Aftermarket Advisory Consulting 2026. All rights reserved.
Quick Links
Get In Touch
Based in the UK, supporting businesses worldwide
Expertise
Independent business management consultancy helping SMEs improve customer retention, satisfaction and revenue from existing customers by strengthening post-sale performance and service operations.
Supporting businesses across Bournemouth, Southampton, Hampshire and Dorset, as well as clients across the UK, and worldwide.